I. – Getting Started
II. – Tier One Plans
III. – Early Warning System
IV. – Moving Between Tiers
VI. - SEL
VII. – 504 Plans
Appendix A. – Guided Plans
Appendix B. – Support Documents
Appendix C. – Video Support
Appendix D. - Frequently Asked Questions
- FAQs
Appendix E. – MTSS Glossary of Terms
Key Features
Summary Report – NEW!
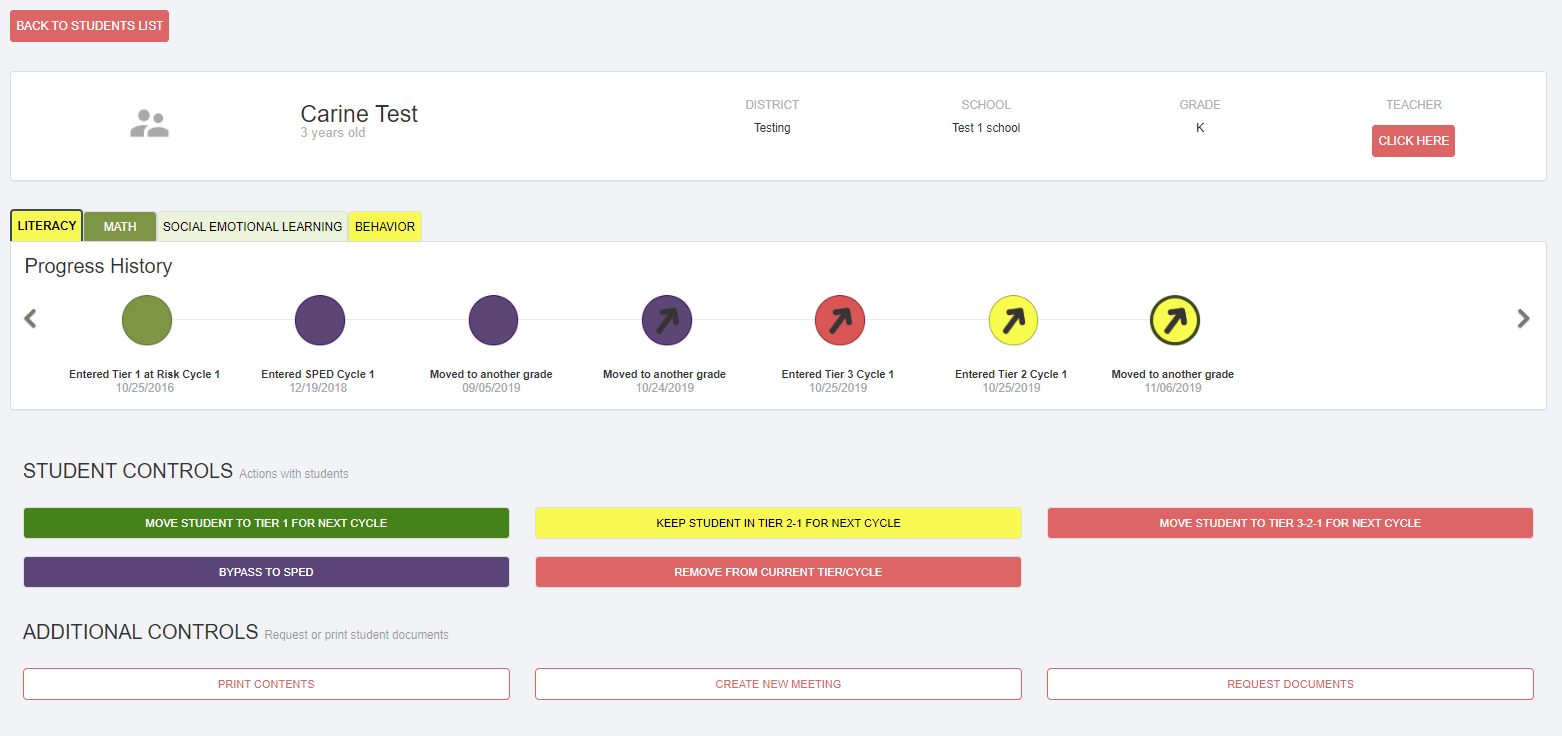
The STUDENT SUMMARY REPORT is all NEW for the 2020-2021 school year!
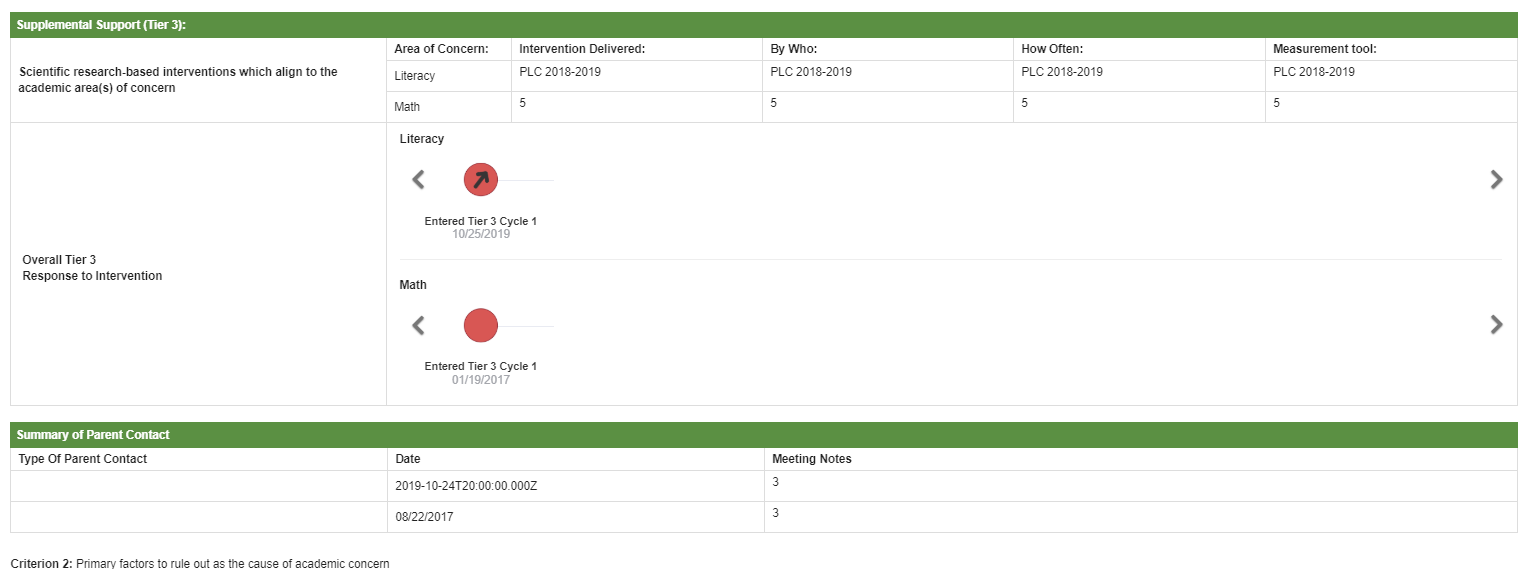
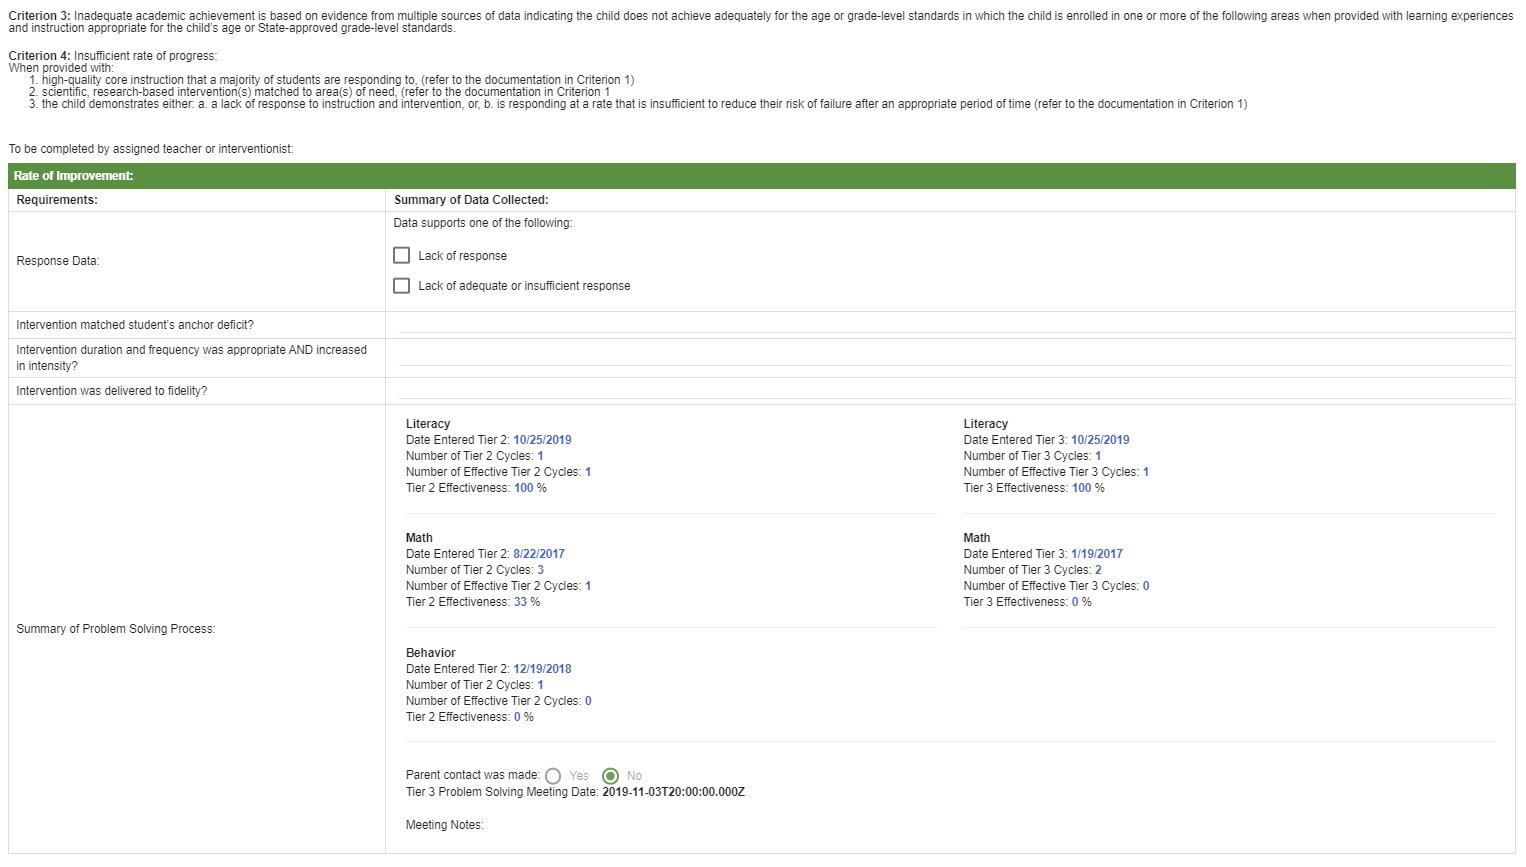
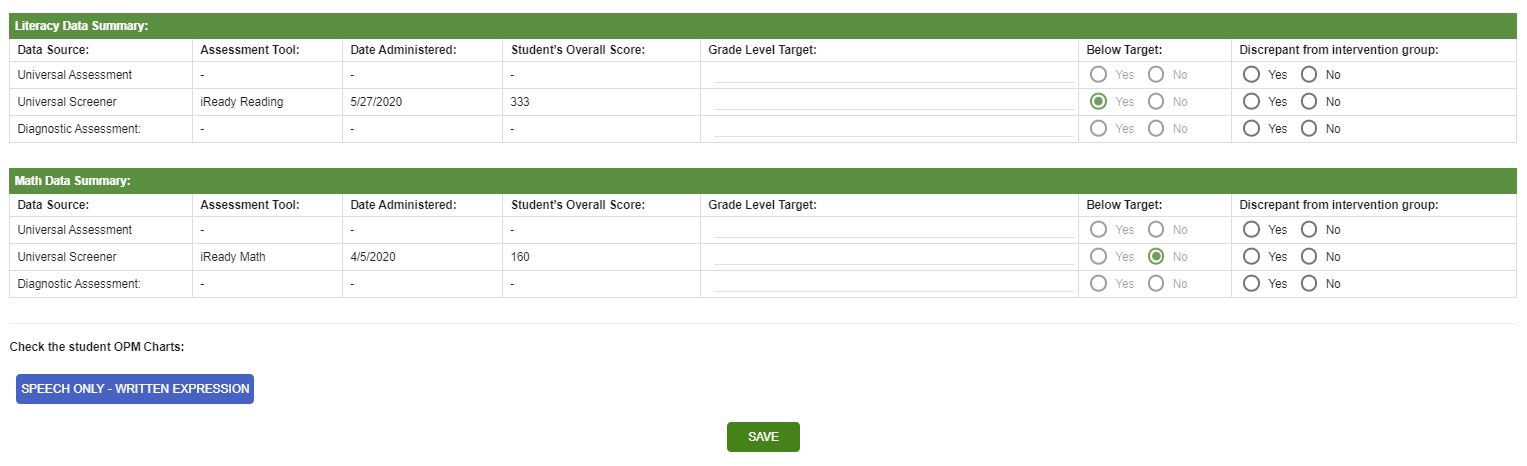
From a student’s file, you can access the student’s demographic information, attendance report, universal screening data, intervention data, summary of parent contacts, exclusionary factors, rate of improvement, and literacy and mathematics summaries.


Schedule Meetings
To create a meeting, filter to the appropriate student screen- depending on your access level:

All students you have access to will appear on this list – 4 areas of concern will show up next to each student.
To create a meeting for a student, they must have been identified as at least Tier 1-At Risk in at least one area of concern.
Click in the white box located under the student’s name.

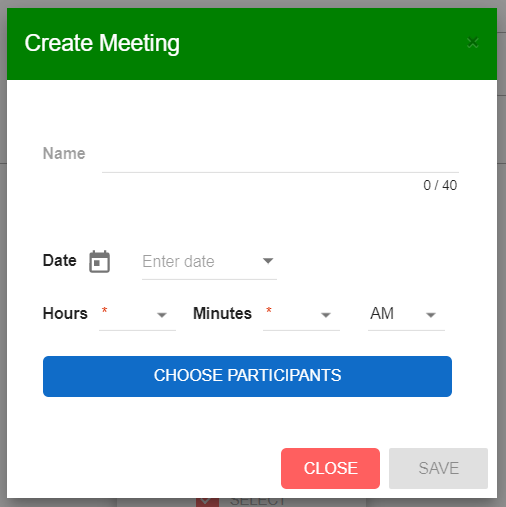
Click on “Create New Meeting” located in the toolbar just above the student list.
You will be prompted to complete the meeting details and choose participants to be invited to the meeting. Participants will receive an email notification for the meeting.
This feature helps to ensure the appropriate people are invited to problem-solving team meetings.
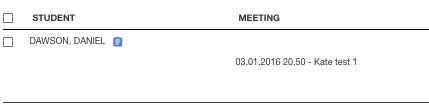
The date/time of the meeting schedule appears on the Student list in the Meeting column directly following the student’s name.
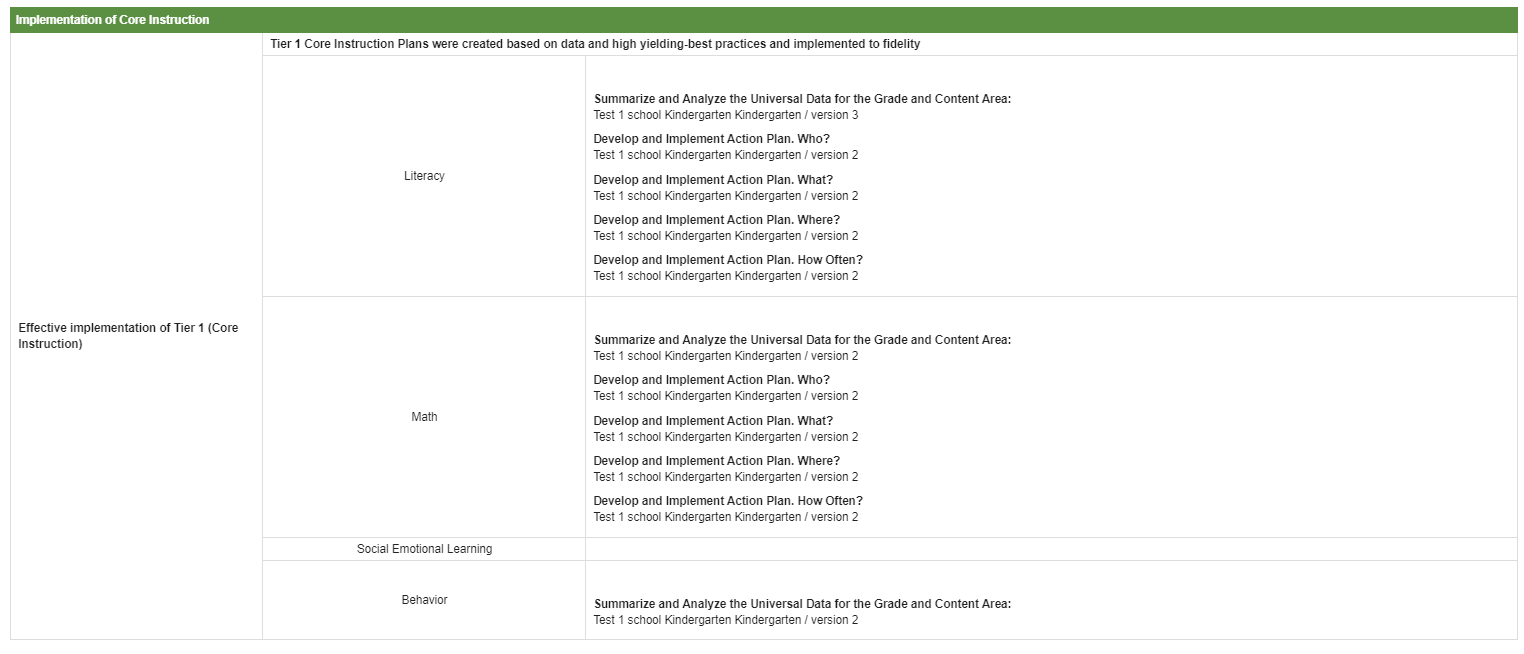
Support for Documentation
The platform supports accurate and cumulative documentation to support decision-making.
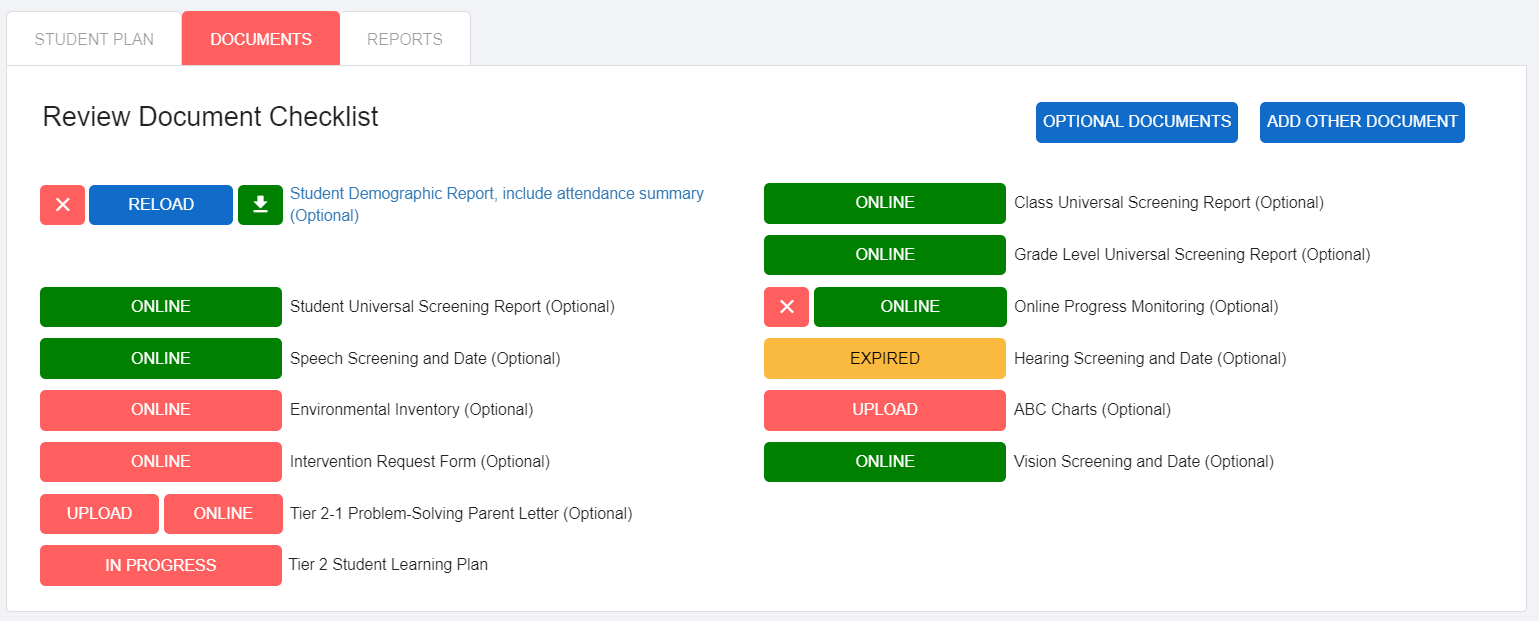
Review Document Checklist
District teams determine the required and optional items that will appear in the Review Documents Checklist section for each tier.
Team determine which documents they will require for a student to:
stay in the same tier for another cycle.
decrease supports and move down in tiers.
increase supports and move up in tiers.
District specific documents are converted into online documents in the platform under each tier.
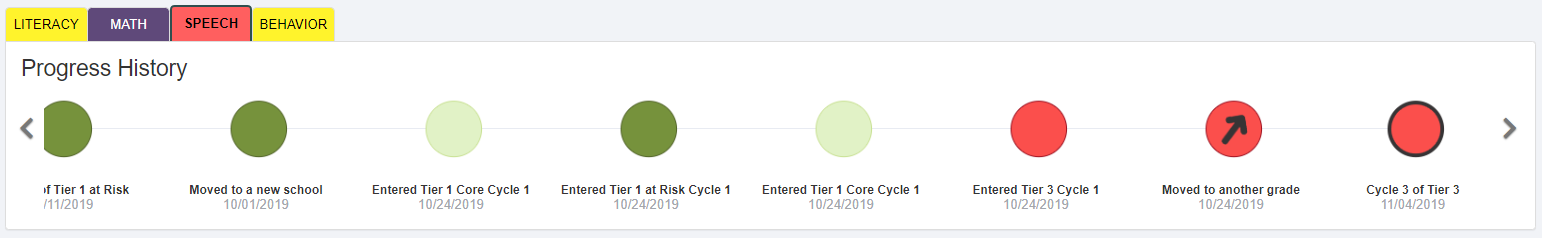
Time Stamped Student Timeline
This timeline feature provides a detailed visual of the cumulative support a student has received in an area of concern.
The date-stamps cannot be edited by users at any level of access. This feature provides an accurate timeline of support provided to the student.
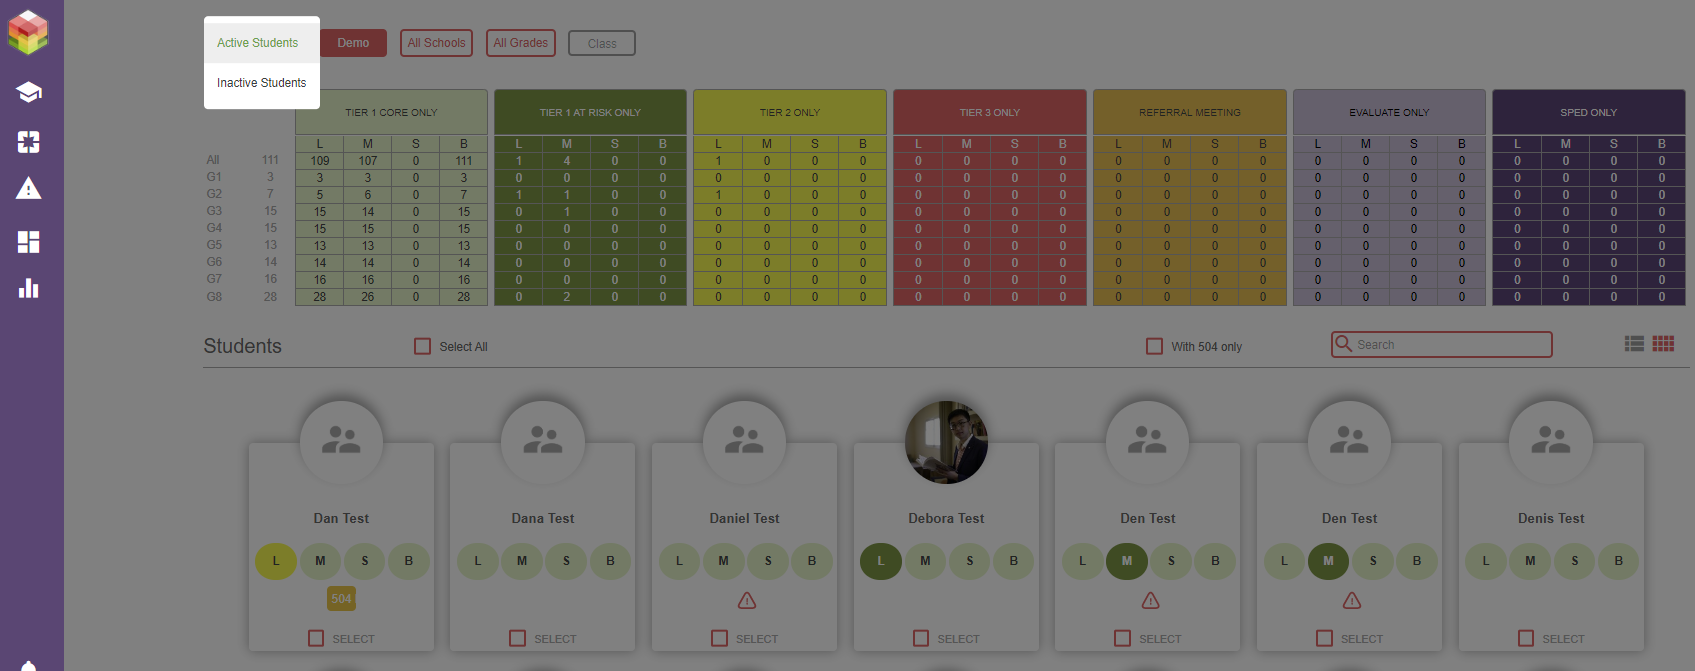
Student Dashboard Filters
Depending on your access level, you can filter your view at the top of the screen using the red buttons. Filters include:
Active/Inactive Students
District
School
Grade
Class
Active/Inactive Student Files
The platform will automatically default to “Active Students” – located in the filter bar under the RtI:Stored! cube.
If a student withdrawals and becomes Inactive in RtI:Stored!, the student’s file will be moved to “Inactive Students”.
Use the drop down filter to navigate between active and inactive students.
Search Bar
A search box is located below the filters in the top right of the screen. This allows you to enter a students’ name and filter your student dashboard accordingly.
Accessing Reports
From the purple navigation bar, select the REPORTS icon to view all reports, according to your access level.


Filter Reports
Use the filters at the top of the screen to select the report you would like to view.
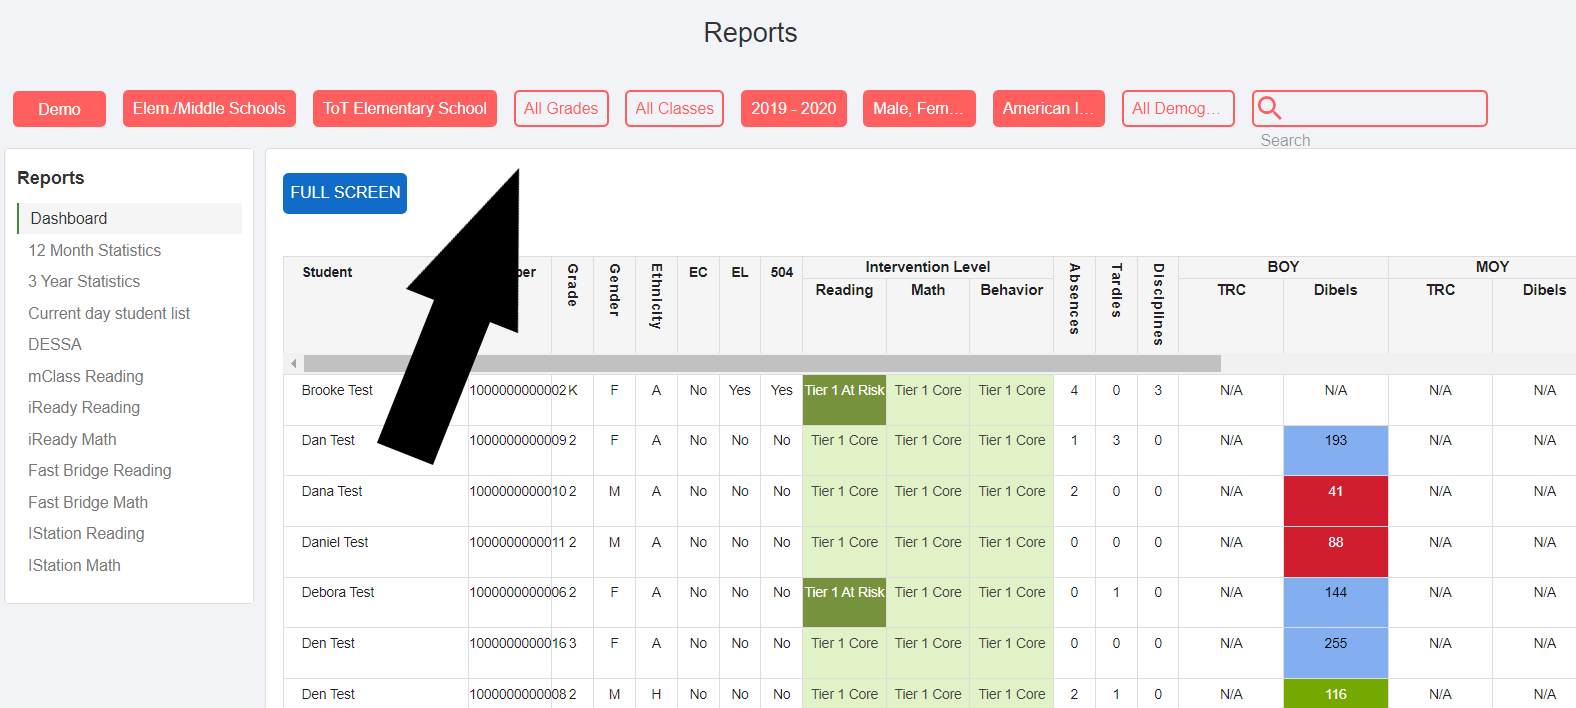
Reports Menu
On the left side of the Reports screen, select the specific report you would like to view, then filter by school, grade level, class, academic year, and other demographic specifications.

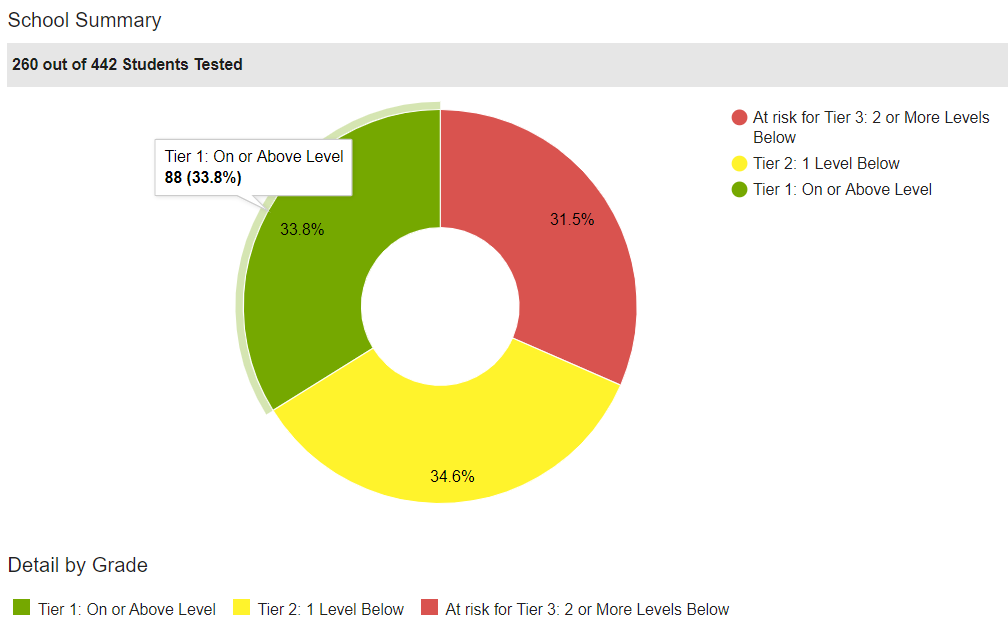
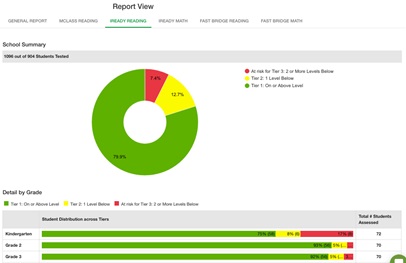
School Summary
Access all district/school universal screening and/or universal assessment reports using the appropriate filters.
Grade Level or Class Summary
Access all grade/class universal screening and/or universal assessment reports using the appropriate filters.
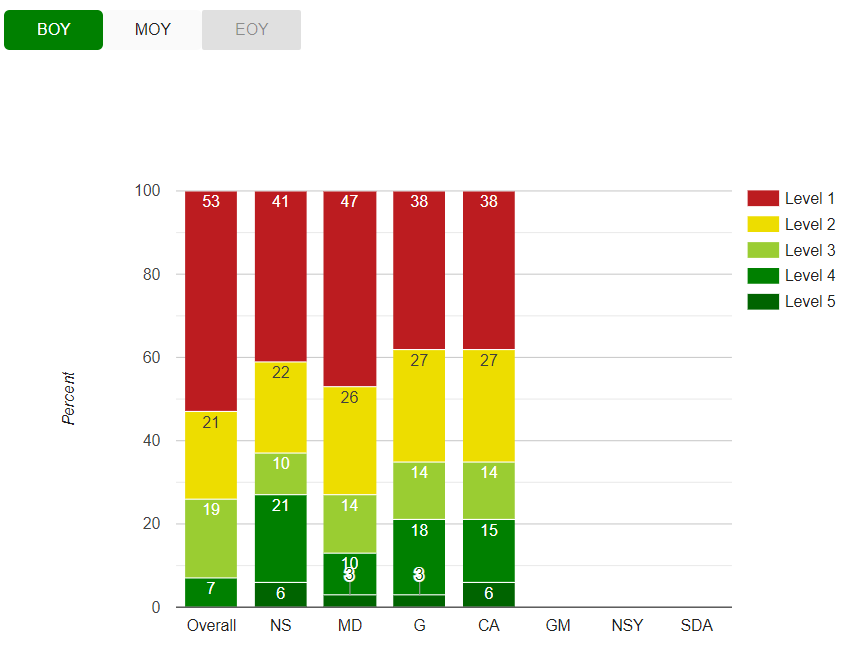
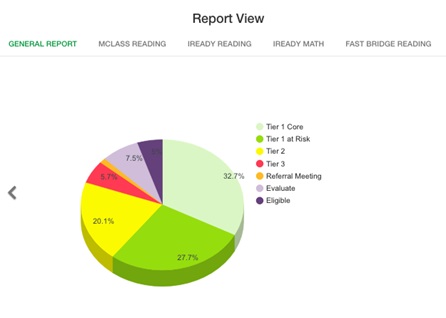
Sample Reports
MClass
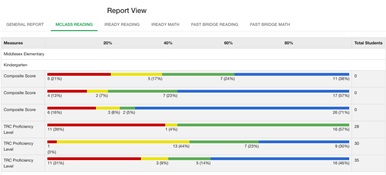
i-Ready
Data Charts
-
Pie Charts provide breakdown of percentages and numbers of ALL students served in general education, through the tiered system of support and those receiving special education services.
-
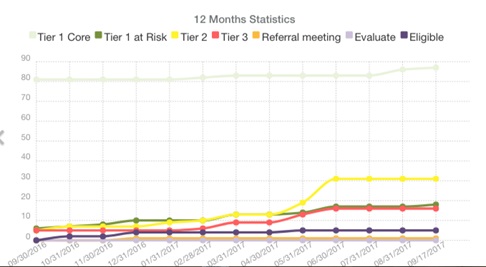
Line Charts provides a month-by-month breakdown of the movement through the tiered levels of support. This data can help drive coaching and support.
![]()
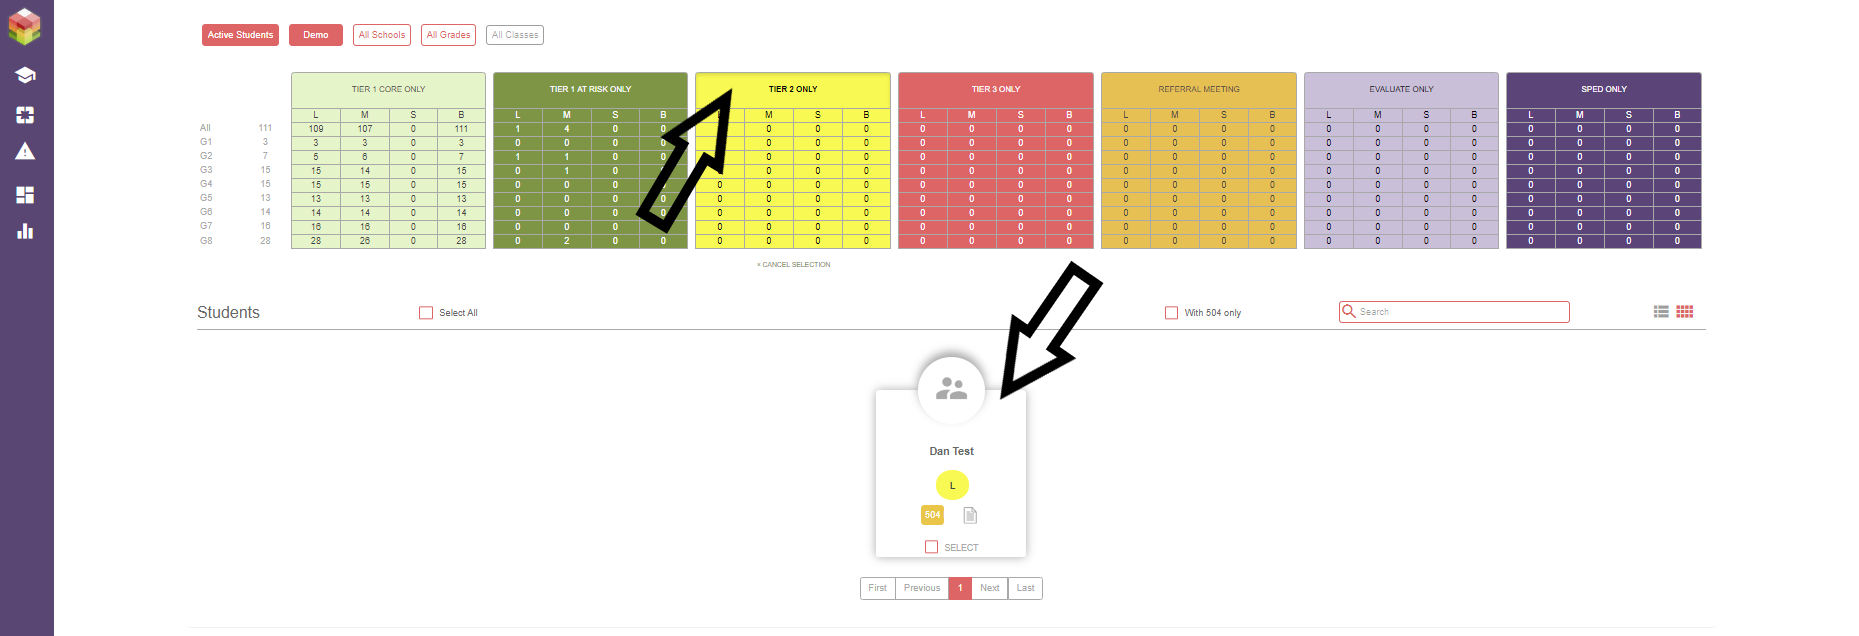
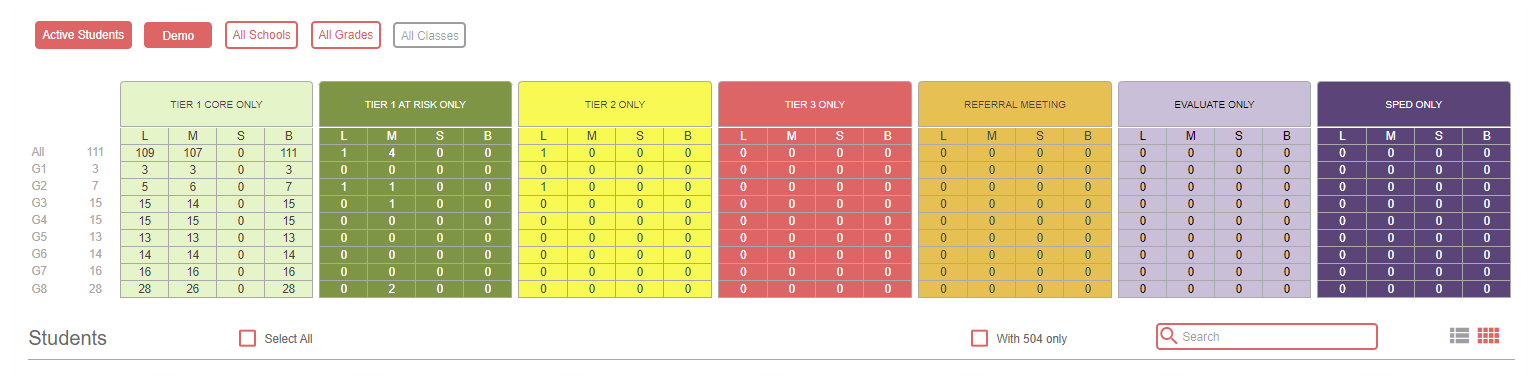
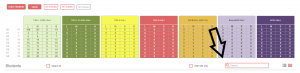
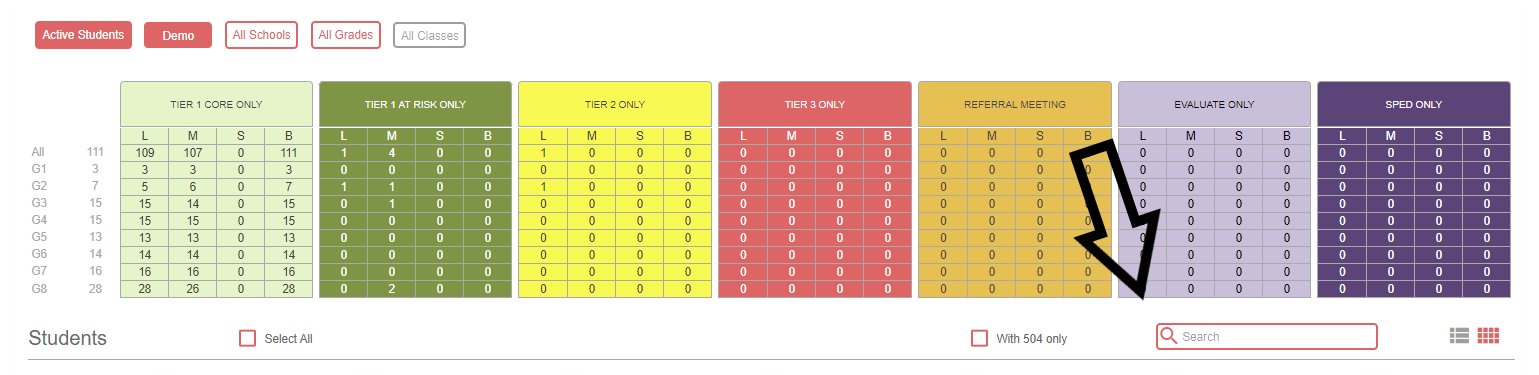
Filterable Reference Chart
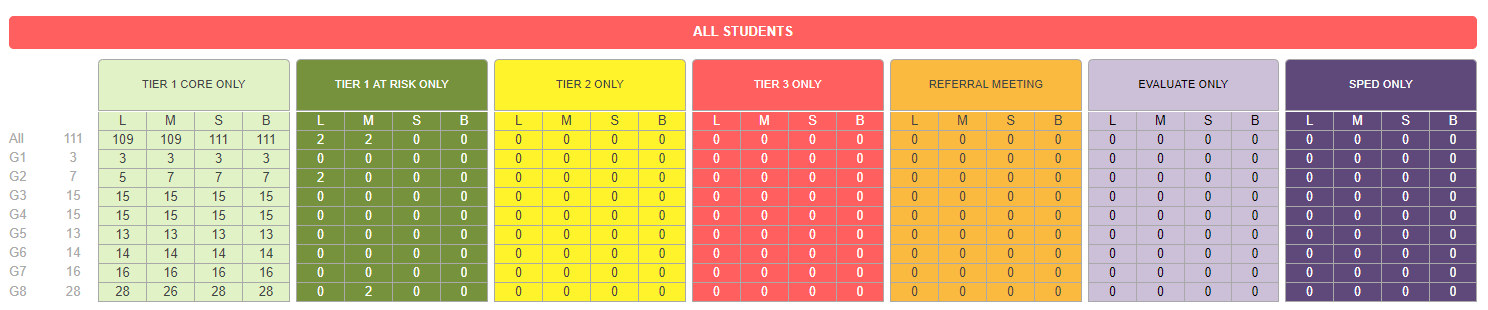
The Reference Chart provides an easily accessible breakdown of the total students receiving each layer of support, by grade level and area of support (Literacy/Mathematics/Social emotional/Behavior).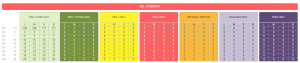
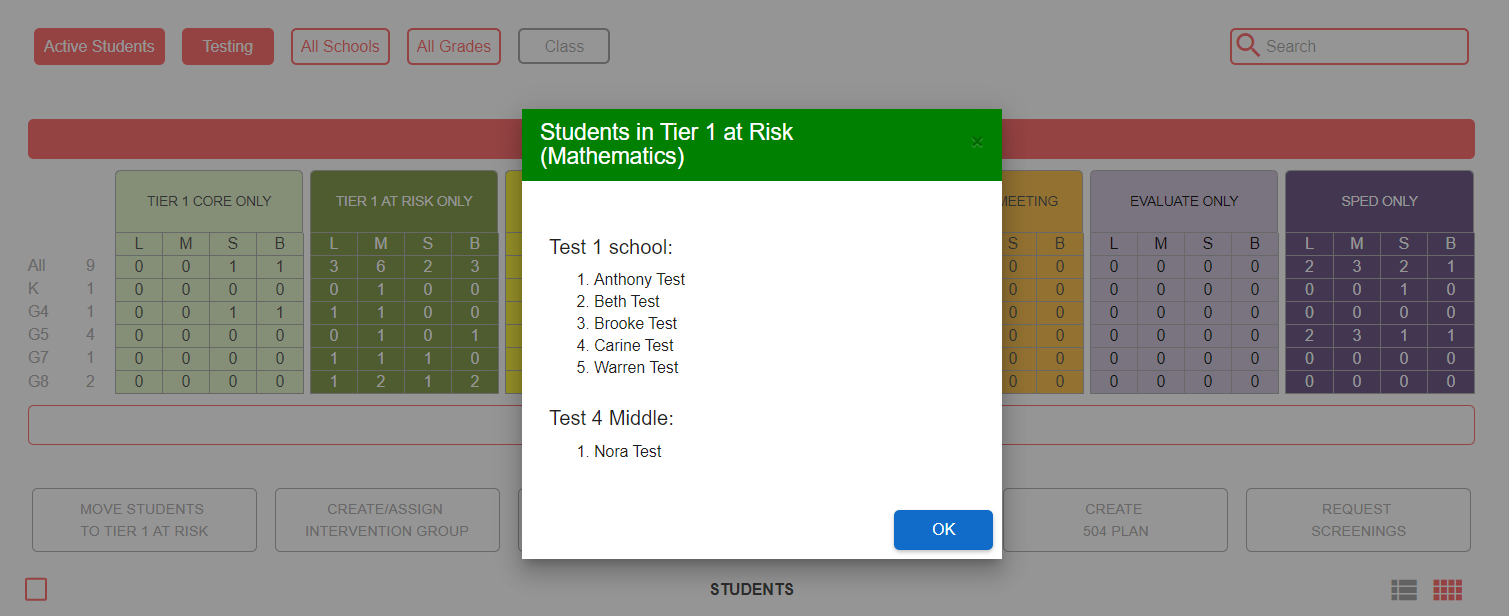
Clicking on a number in this Reference Chart provides you with a list of students represented by that number and their teachers’ names.
 By clicking on a column header you can filter the student dashboard to only display students receiving support in that tier.